S&P/Case-Shiller Home Price Index
August 28, 2013
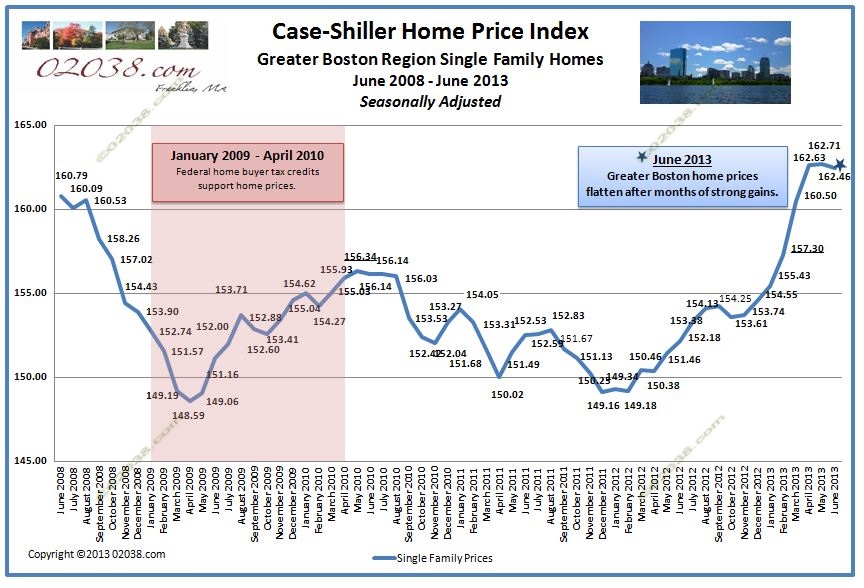
Nothing goes up in a straight line forever. After rising nearly 6% over 8 consecutive months since last October, Greater Boston home prices moved fractionally lower […]
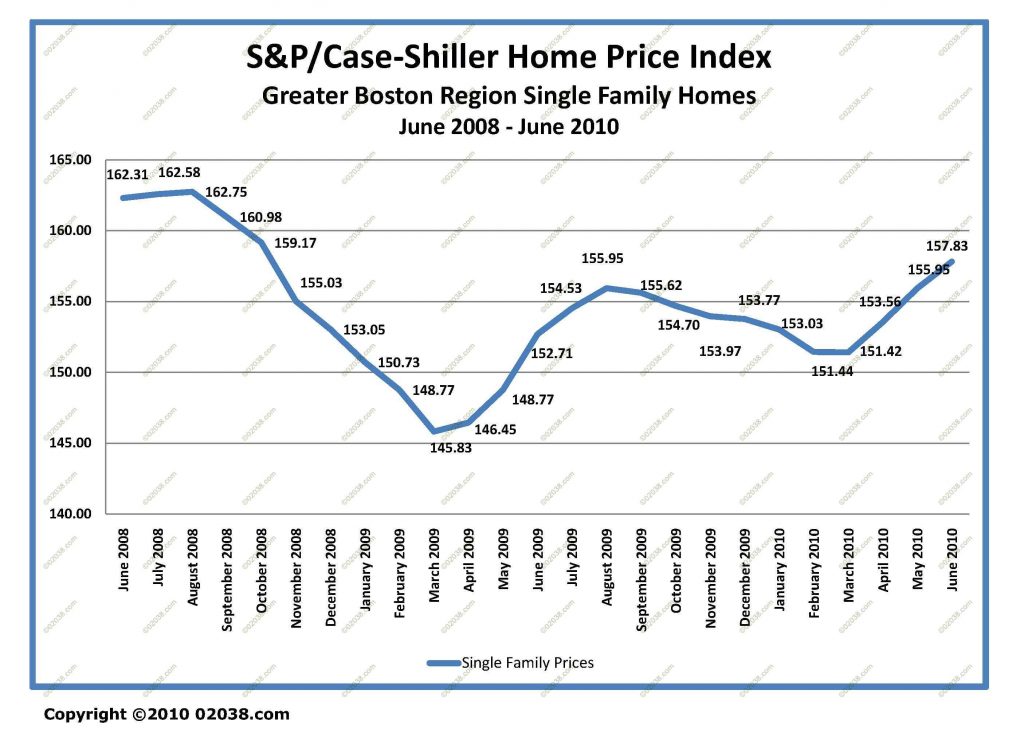
August 31, 2010
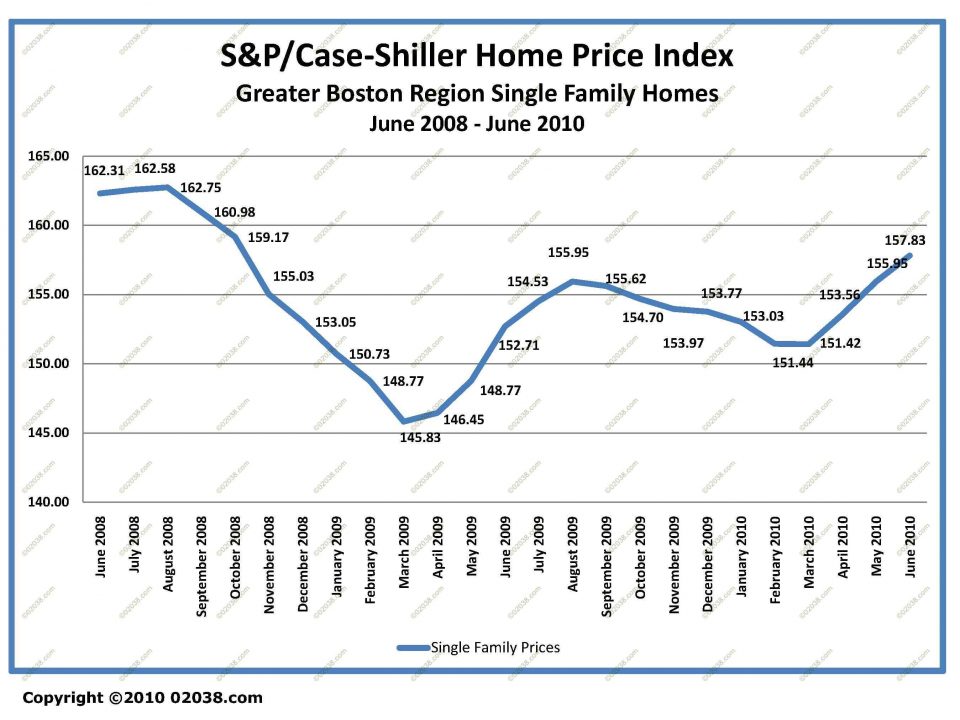
In data released today, Standard and Poors reported that Greater Boston single family home prices rose 1.2% in June. This was the third month in row […]
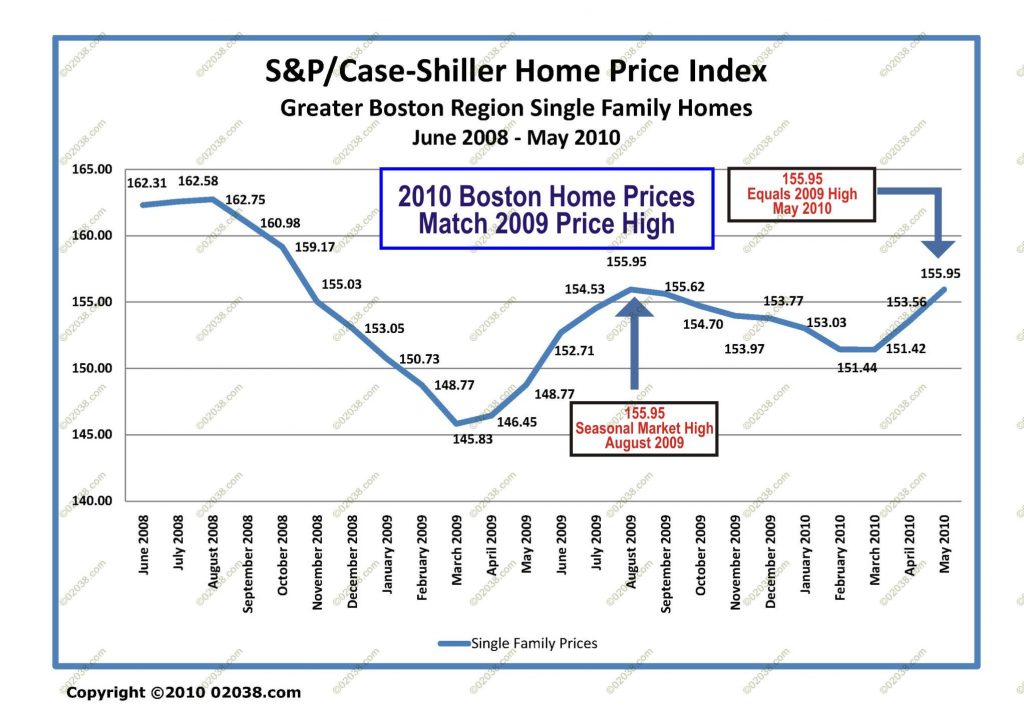
July 28, 2010
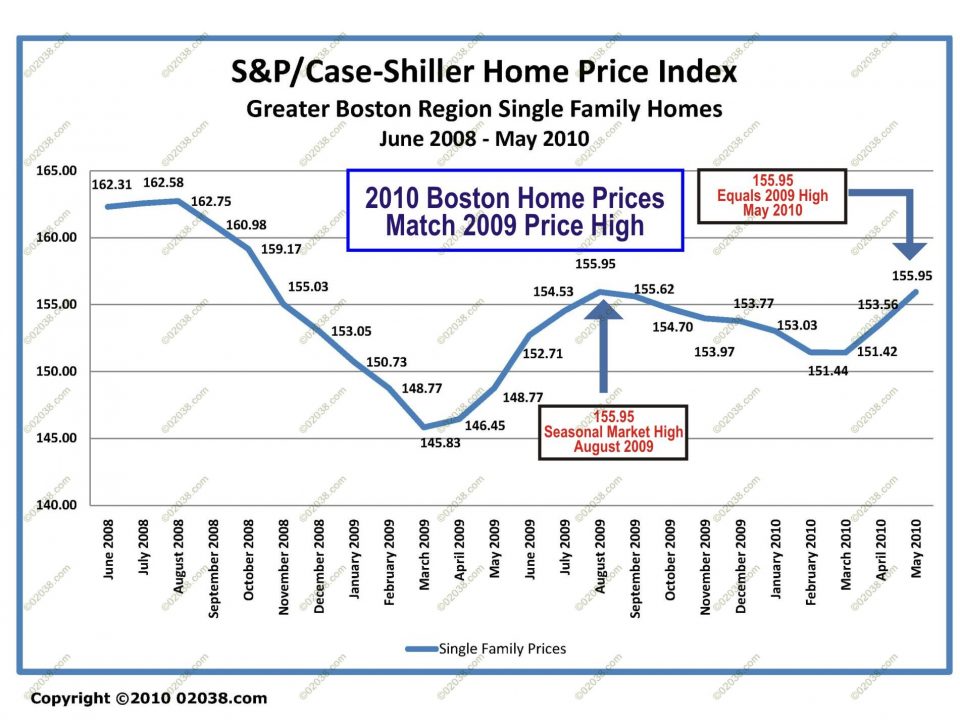
Greater Boston single family home prices rose 1.5% in May, according to the Standard & Poor’s/Case Shiller home price index for the Boston metro area. The […]
January 30, 2010
Two reports issued separately last week paint a relatively upbeat picture of Massachusetts real estate as we get ready for the Spring 2010 prime home selling […]
September 29, 2009
The S&P/Case-Shiller Home Price Index for Greater Boston has erased all of the declines it experienced in 2009 and is now higher than it was back […]
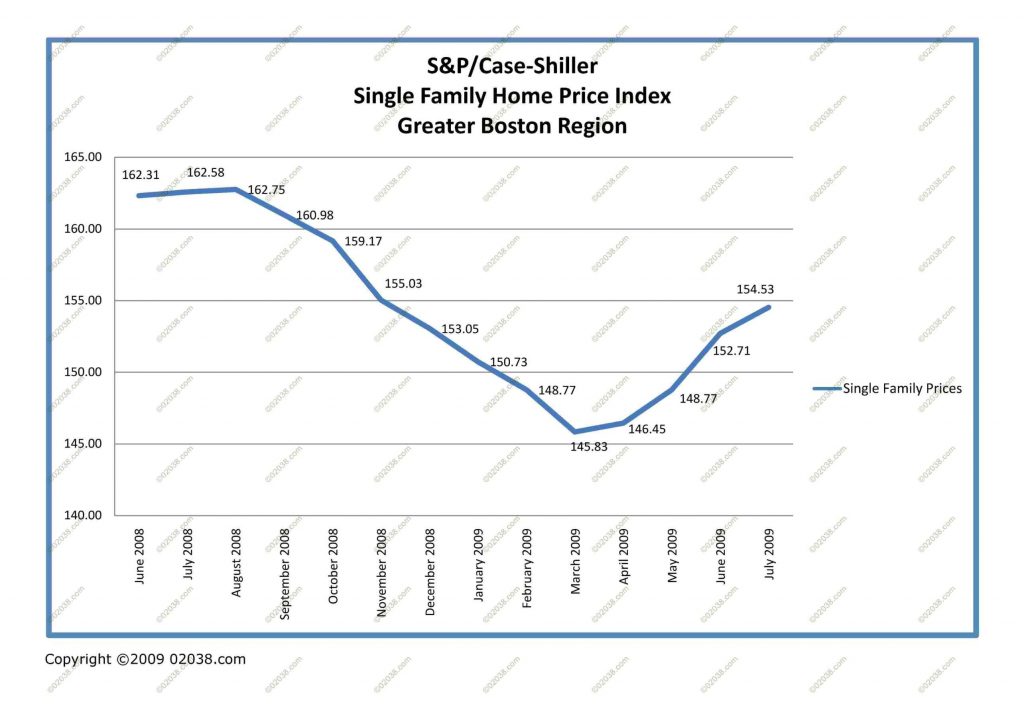
August 25, 2009
Single family home prices in Greater Boston rose 2.6% in June 2009, according to figures released today by Standard and Poor’s. June’s 152.71 reading on the S&P/Case-Shiller […]
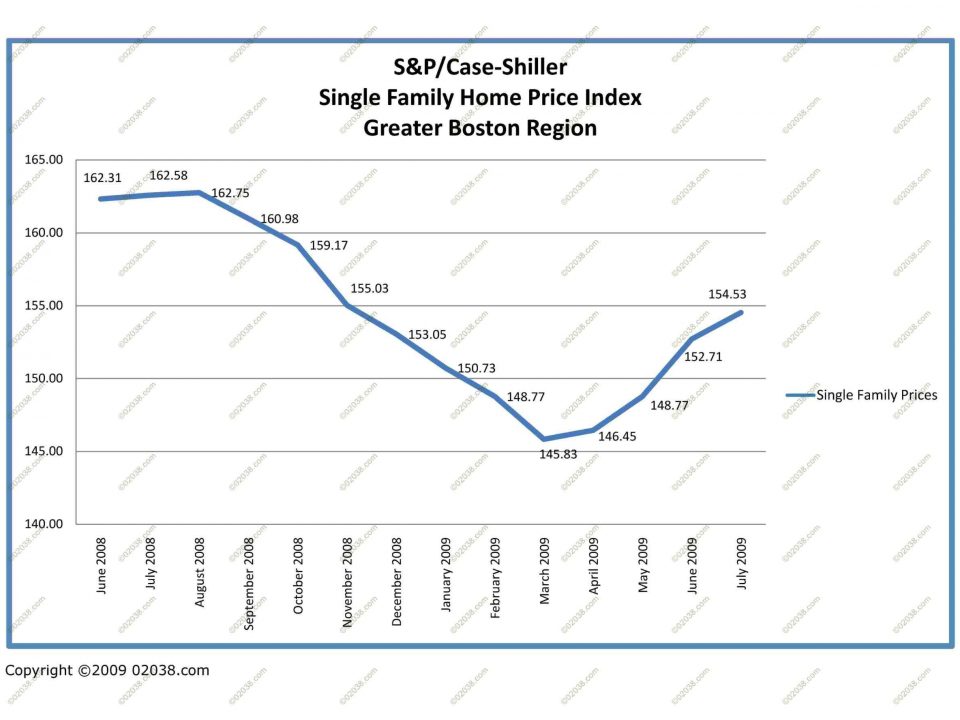
June 30, 2009

Home owners throughout Massachusetts received some very welcome news today from Standard and Poor’s. Boston metro area home prices rose 0.4% in April 2009 according to […]


