Case Shiller Index Boston
February 6, 2019
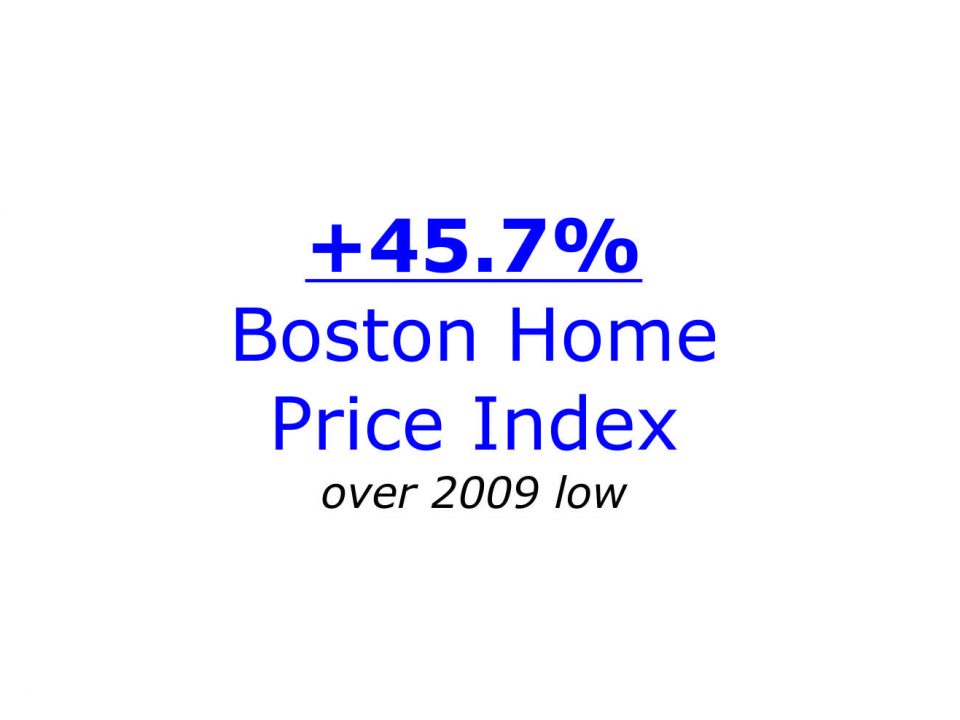
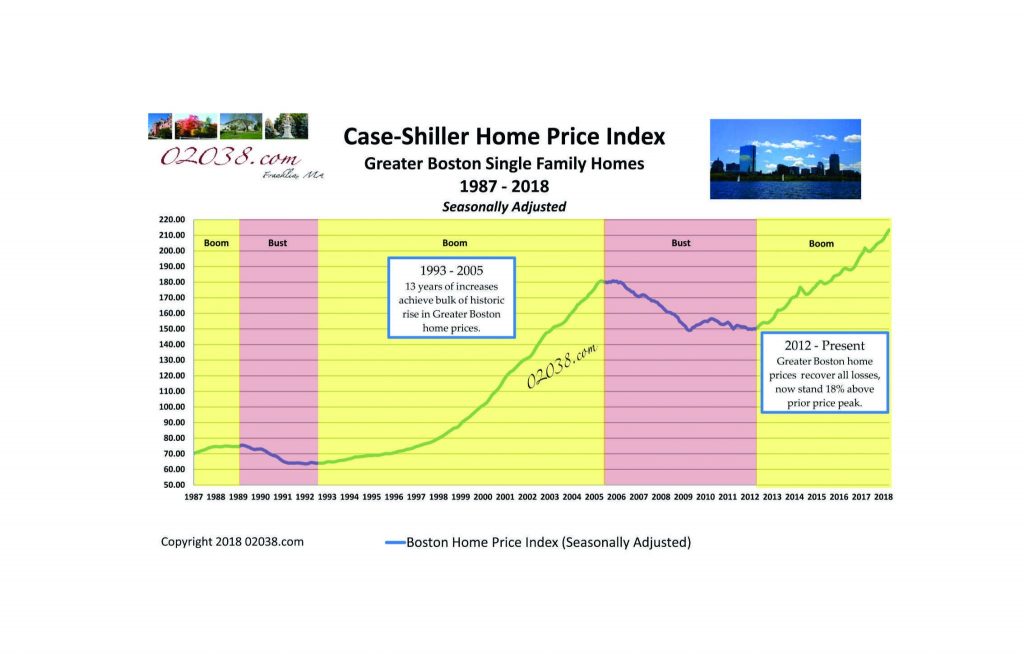
The seasonally adjusted Case-Shiller Boston Home Price Index, which has repeatedly hit all-time highs since 2016, keeps powering upwards. The latest reading of the benchmark Boston […]
July 5, 2018
The Massachusetts real estate market is currently a feast for home sellers. Demand for homes – and home sale prices – continue to soar in 2018. […]
November 8, 2017
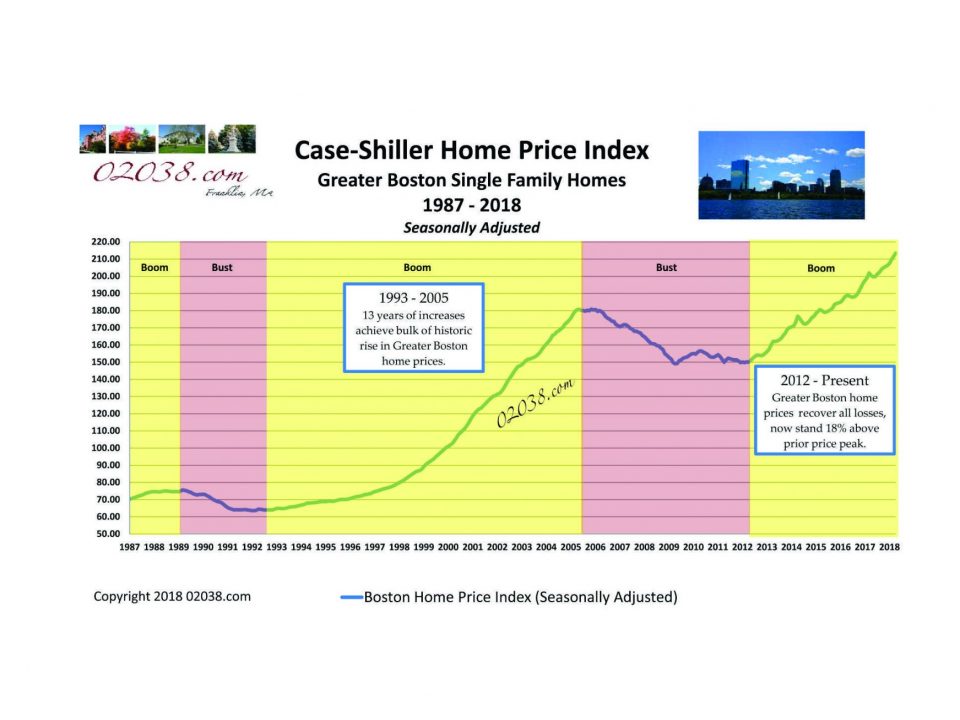
The Case-Shiller Home Price Index for Boston has hit another all time high. The seasonally adjusted Boston Index topped 202 for the first time in its […]
October 3, 2017

Have you have been wondering why it’s almost impossible to find a decent home at an affordable price in Greater Boston? A presentation made earlier this […]
June 5, 2017

Greater Boston home prices keep setting records! The seasonally adjusted Case-Shiller Home Price Index for Boston climbed above 200 for the first time in its 30 […]
March 10, 2017

Up 94 percent since 2000! That’s the hefty gain recorded by Greater Boston single family home prices in the 16 years since start of the 21st […]
December 1, 2016

With homes in Massachusetts selling at a record pace and Greater Boston home prices surging nearly 5% above their previous all time high, economists and housing […]
July 18, 2016

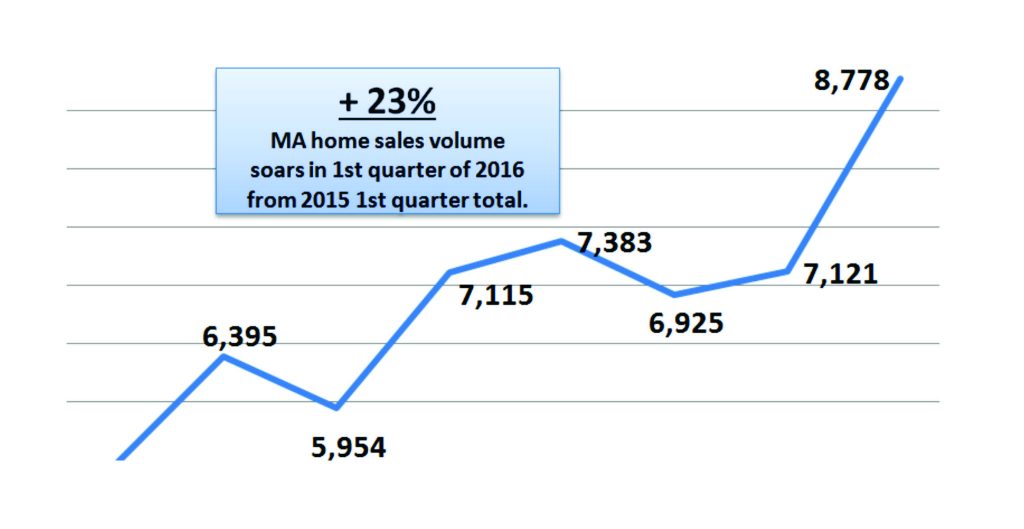
The Massachusetts real estate market is posting banner sales results this year. MA single family home sales volume jumped 18.5% in the first half of 2016, […]
April 18, 2016
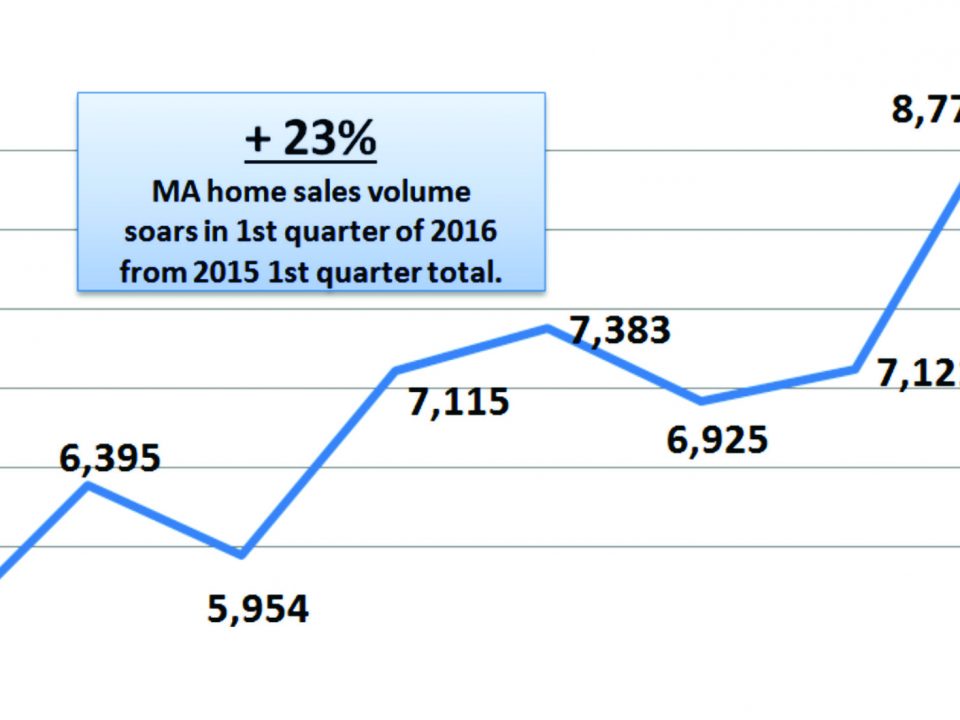
With the Case-Shiller Home Price Index for Boston at all-time highs as 2016 got underway, the stage was set for robust home sales in Massachusetts during […]
January 18, 2016

The number of single family homes sold in Massachusetts in 2015 soared to record highs, according to data provided by MLSPIN. Home sales volume across MA […]
November 2, 2015

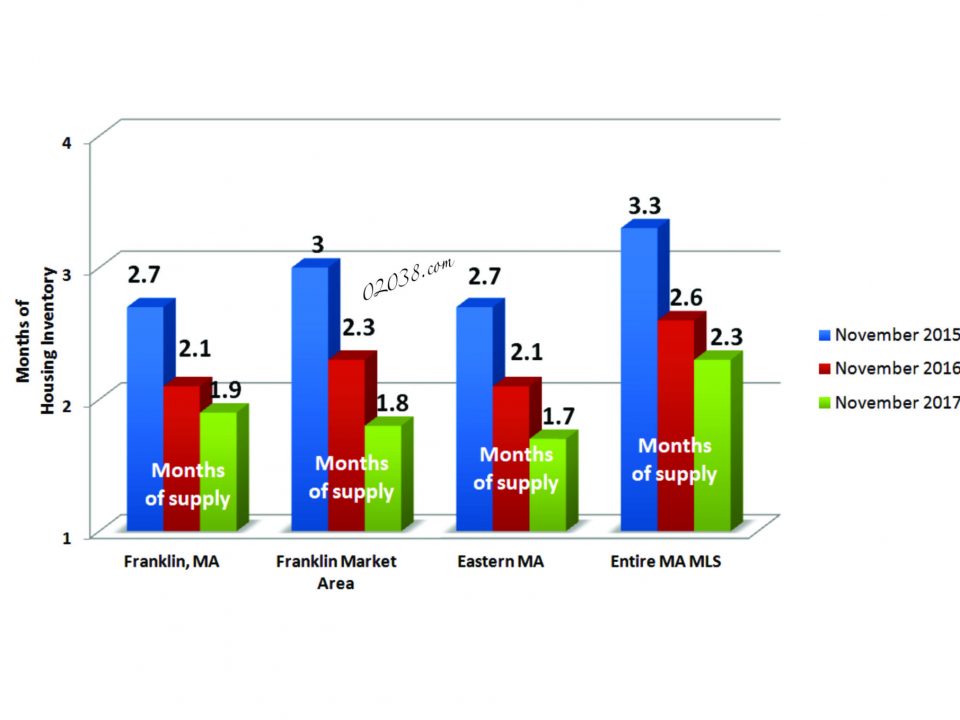
Home buyers looking for a good deal this fall may be hard pressed to find bargains in the Bay State. Greater Boston home prices are now […]
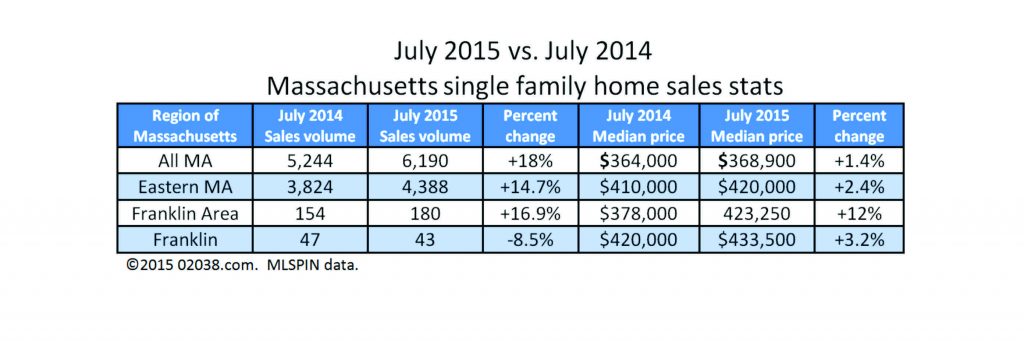
August 5, 2015
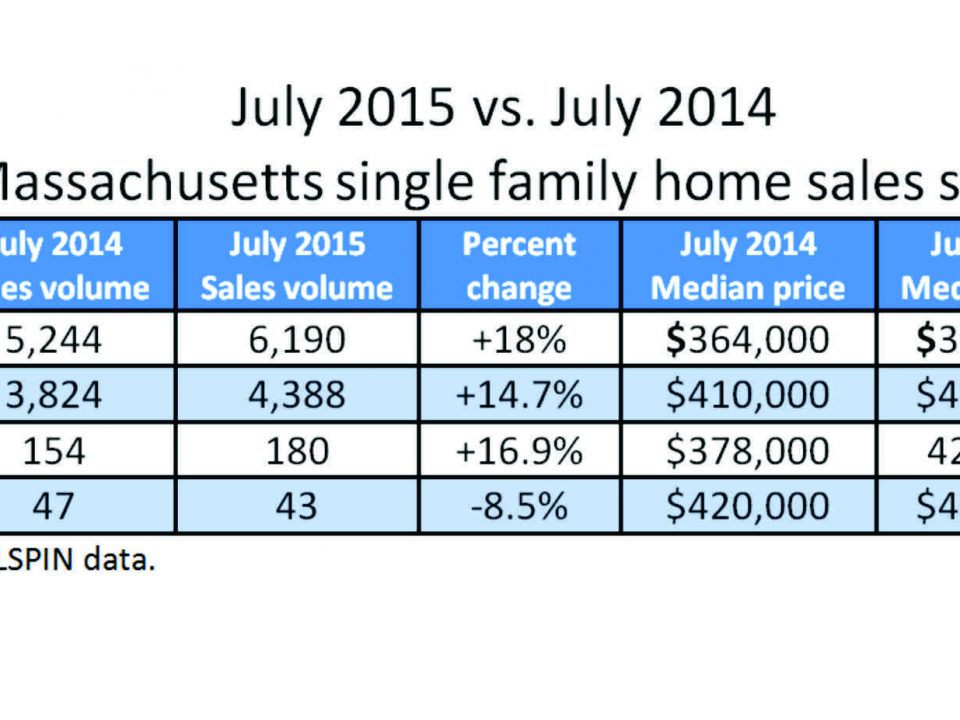
The Case-Shiller Home Price Index for Boston declined recently for the second straight month this year. May’s reading of 178.94 puts the seasonally adjusted Index roughly […]


